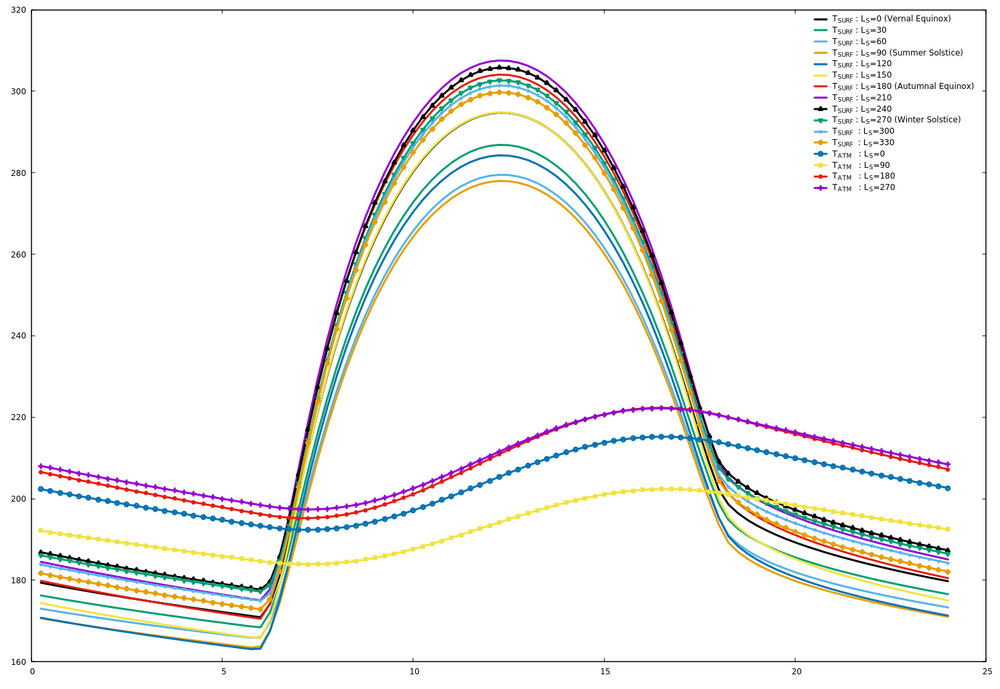
Diurnal Temp Plot
The larger amplitude curves are Kinetic Surface Temperatures for an entire day during 12 different times of year. The reason for plotting several different times of year is to determine whether the diurnal temperature curves indicate a yearly trends. These curves reveal a general trend of lower temperatures in the morning followed by a rapid increase in temperature, peaking into the early afternoon, followed by a rapid decrease in temperature into the early evening, at which point the temperature decreases gradually until early morning again.
The curves indicate Autumn into Winter has the highest temperatures, whereas Spring into Summer has the lowest temperatures all year.
The smaller amplitude curves represent Atmospheric Temperatures for an entire day during the solstices and equinoxes. These curves indicate more gradual and less extreme temperature changes than the surface. Note that the lowest temperature curve is still the summer solstice, giving credence to the previous annual temperature interpretations.
