KRC for Phobos
Basic Case
Phobos models require to specify body = "Phobos"
out = krc(lat=12.,INERTIA=50.,body="Phobos",LKofT="T")
Fluxes from Mars
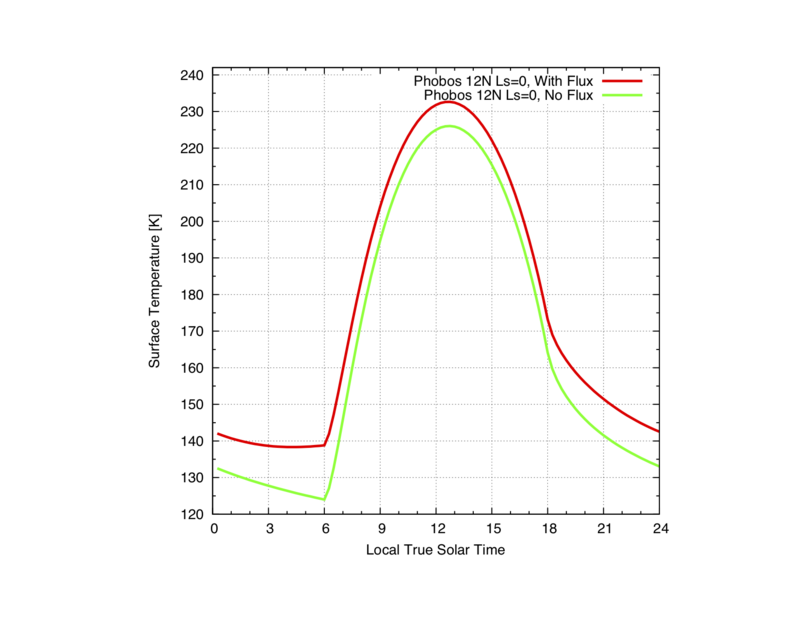
Generally, Phobos modeling requires the addition of the visible and IR fluxes from Mars:
out = krc(lat=12.,INERTIA=50.,body="Phobos",LKofT="T",PFlux="T",Lon_Hr=8.)
...if standard flux values are acceptable (i.e., broad assumption on Mars surface temperature, and albedo). Fluxes are set with PFlux = "T", and by setting Lon_Hr.
Lon_Hr is the surface longitude relative to the sub-Mars point, expressed in hours. Phobos being tidally locked, Lon_Hr = 12. is the sub-Mars point (max fluxes), and 0. for the center longitude of Phobos hidden face. Note 18 < Lon_Hr%24 < 6 corresponds to the Phobos hidden face, so no fluxes are contributed in these cases.
Generally, for tidally locked bodies, the sub-planet point (sub Mars point for Phobos is located ~ at longitude = 0), so that Lon_Hr can be derived from the longitude modeled on Phobos ore any tidally locked body:
Lon_Hr = (24/360 x (180 - longitude west))%24
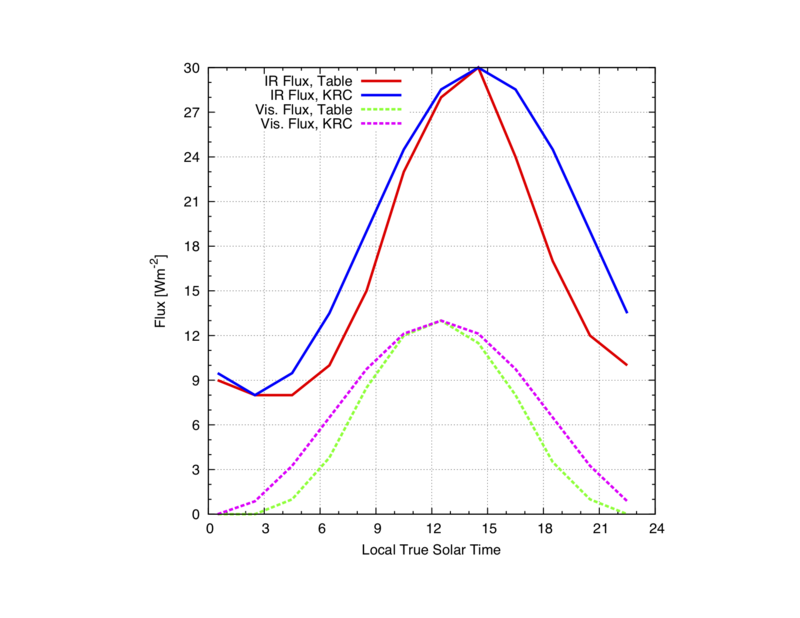
Alternatively, the user can provide Visible and IR fluxes versus local time (krc_planetary_flux_table() generates the input parameters) with the understanding that a simple sin curve is used for the fit. An external model or a set of dedicated KRC runs can be used to determine the IR and Visible flux versus local time, as seen from Lon_Hr and the specified latitude.
The figure below shows the externally provided values ("IR Flux, Table", and "Vis. Flux, Table", the associated sin fits fed to KRC by the interface ("IR Flux, KRC", and "Vis Flux, KRC"). Note that the user can tweak the fluxes to improve the overall accuracy of the function parameters fed to KRC.
If a user wants to improve the parameters fit fed to krc, the step below describe how to proceed. First, et's create flux tables manually:
 Lon_Hr        = 10.
 LTST          = create(1,12,1,start=0.5,step=2,format=float)
 IR_Table      = translate(00.0//00.0//01.0//03.8//08.5//12.0//13.0//11.5//08.0//03.5//01.0//00.0,from=x,to=y)
 Vis_Table     = translate(09.0//08.0//08.0//10.0//15.0//23.0//28.0//30.0//24.0//17.0//12.0//10.0,from=x,to=y)
These few lines reproduce the steps followed by krc_planetary_flux_table() to generate the input line:
 Vis_1         = cat(Vis_Table,LTST,axis=x)
 IR_1          = cat(IR_Table,LTST,axis=x)
 IR            = IR_1[1,,1]                                                    #IR array, y axis
 LTST_IR       = IR_1[2,,1]                                                    #LTST for the IR array, y axis
 Vis           = Vis_1[1,,1]                                                   #Vis array, y axis
 LTST_Vis      = Vis_1[2,,1]                                                   #LTST for the Vis array, y axis
 Peak_IR       = maxpos(IR,showval=1)
 Min_IR        = minpos(IR,showval=1)
 LTST_IR_Peak  = LTST_IR[1,int(Peak_IR[2,1,1]),1]                              #int(Peak_IR[2,1,1]) is the index
 Half_Amp_IR   = 0.5*(Peak_IR[4]-Min_IR[4])
 Phase_IR      = 360.*LTST_IR_Peak/24.                                         #in degree
 IR_KRC        = (Min_IR[4] + Half_Amp_IR * (1 + cosd(360.*LTST_IR/24. - Phase_IR)))
 Peak_Vis      = maxpos(Vis,showval=1)
 Min_Vis       = minpos(Vis,showval=1)
 LTST_Vis_Peak = LTST_Vis[1,int(Peak_Vis[2,1,1]),1]                            #int(Peak_IR[2,1,1]) is the index
 Half_Amp_Vis  = 0.5*(Peak_Vis[4]-Min_Vis[4])
 Phase_Vis     = 360.*LTST_Vis_Peak/24.                                        #in degree
 Vis_KRC       = (Min_Vis[4] + Half_Amp_Vis * (1 + cosd(360.*LTST_Vis/24. - Phase_Vis)))
Now a comparison of the user-provided fluxes and the fit fed to krc (see Figure above):
plot(Vis_Table,"User-provided Vis from Mars",IR_Table,"User-provided IR from Mars",Vis_KRC,"KRC-derived Vis from Mars",IR_KRC,"KRC-derived IR from Mars",(Vis_Table+IR_Table)-(IR_KRC+Vis_KRC),"User-provided vs KRC_provided",w=4,Xaxis=LTST)
This line generates the line for the input file (done with the .dvrc when IR and Vis are provided):
test = krc_planetary_flux_table(IR_1,Vis_1,Lon_Hr)
In this case, the flux from Mars on Phobos can be formalized like this:
out = krc(lat=12.,INERTIA=50.,body="Phobos",LKofT="T",PFlux="T",Lon_Hr=8.,IR=IR,Vis=Vis)
See below a comparison of the predicted surface temperature with and without Mars IR and visible shine on Phobos:
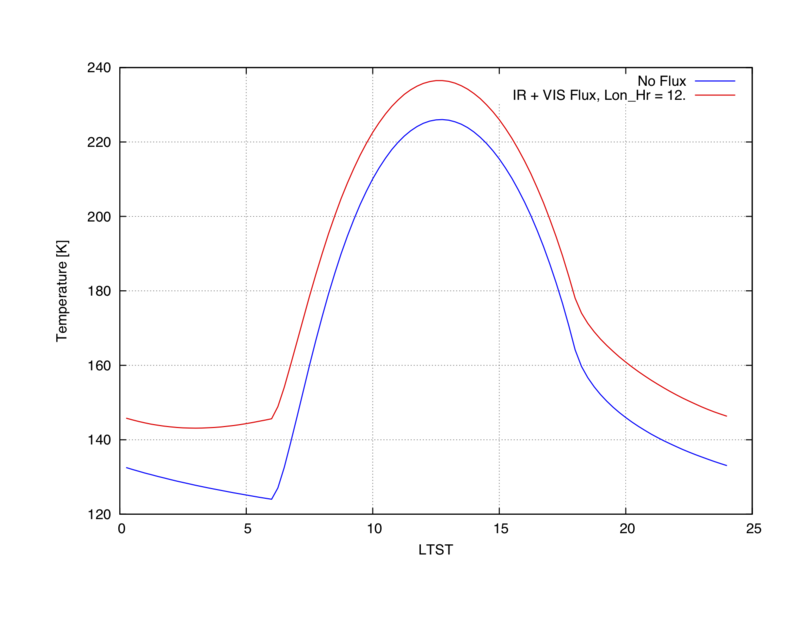 Comparison between No Flux, and Flux at the Sub Mars point
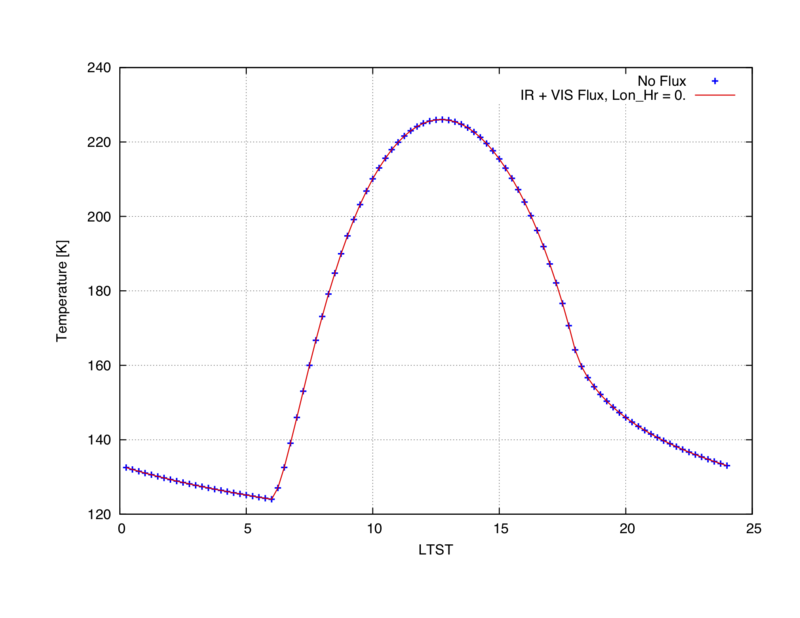 Comparison between No Flux, and Flux received from the hidden face (none), i.e., no forcing.
Mars Eclipses
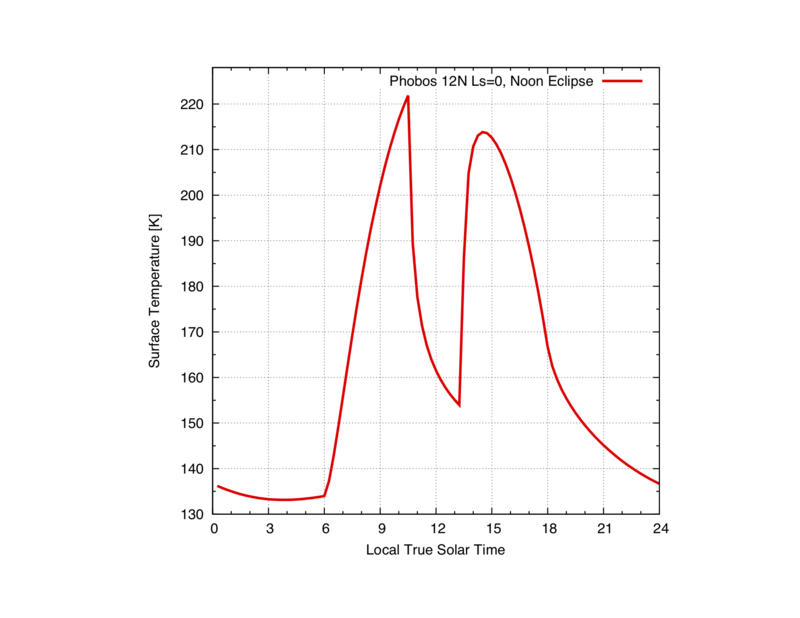
To include the eclipse by Mars using standard Phobos/Mars orbital properties:
Eclipse       = "T"                                              #forces an eclipse (Default = "F")
Eclipser      = "Mars"                                           #Eclipser name
Ecl_Cent_Hr   = 12.                                              #Eclipse central hour
Bias          = 0.0                                              #Eclipse Bias (0 => perfect alignement; 1 => partial eclipse)
Eclipse_Style = 1
Date          = 0.
Default flux from Mars:
out = krc(lat=12.,INERTIA=50.,body="Phobos",LKofT="T",PFlux="T",Lon_Hr=8.,Eclipse=Eclipse,Eclipser=Eclipser,Ecl_Cent_Hr=Ecl_Cent_Hr,Bias=Bias,Eclipse_Style=Eclipse_Style,Date=Date)
User-provided flux from Mars:
out = krc( lat=12.,INERTIA=50.,body="Phobos",LKofT="T",PFlux="T",Lon_Hr=8.,IR=IR,Vis=Vis,Eclipse=Eclipse,Eclipser=Eclipser,Ecl_Cent_Hr=Ecl_Cent_Hr,Bias=Bias,Eclipse_Style=Eclipse_Style,Date=Date)
When working with Phobos eclipses, it may be beneficial to increase the time resolution of the output by increasing N24
out = krc(lat=12.,INERTIA=50.,body="Phobos",LKofT="T",PFlux="T",Lon_Hr=8.,IR=IR,Vis=Vis,Eclipse=Eclipse,Eclipser=Eclipser,Ecl_Cent_Hr=Ecl_Cent_Hr, Bias=Bias,Eclipse_Style=Eclipse_Style,Date=Date,N24=96*100)
