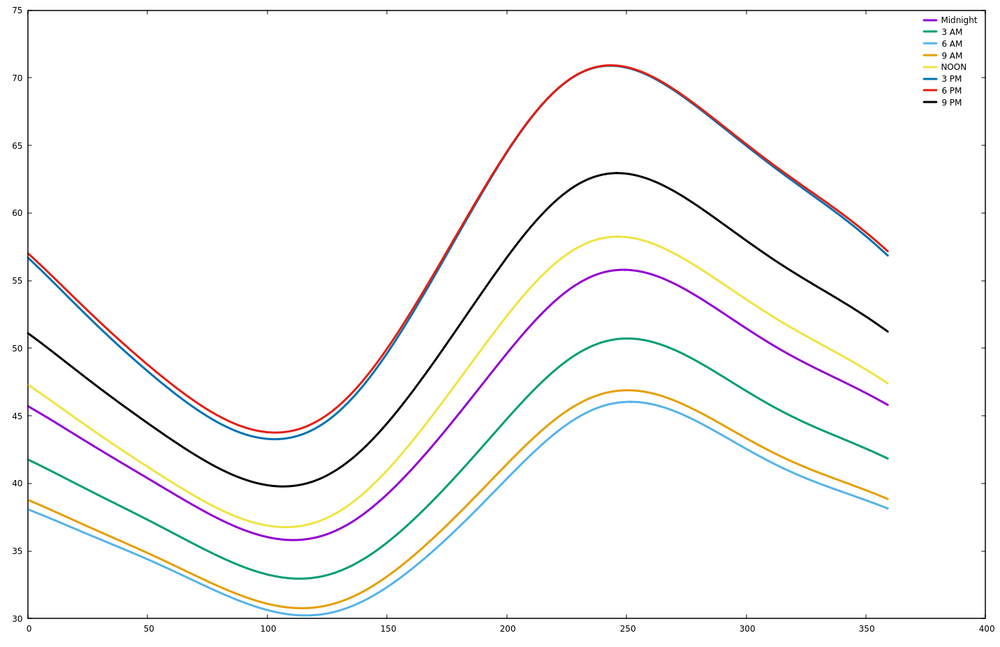
Downward Thermal Flux Plot
From krc
(Difference between revisions)
(Created page with "1000px This seasonal temperature plot indicates general trends in the changes in downward thermal flux reaching the surface over the course of the year ...") |
Latest revision as of 16:51, 17 July 2017
This seasonal temperature plot indicates general trends in the changes in downward thermal flux reaching the surface over the course of the year at 8 different times of day.
