Dust Opacity For Mars
(→Adjust for wavelength) |
(→Lander or Rovers: Elevation-Specific Opacity) |
||
| Line 60: | Line 60: | ||
plot(test.anc.ref_pressure,"KRC",xaxis=test.ls) | plot(test.anc.ref_pressure,"KRC",xaxis=test.ls) | ||
| − | |||
| − | |||
| Line 88: | Line 86: | ||
Note that if an opacity vs. Ls is provided, TAU is the visible opacity at a pressure of PTOTAL. | Note that if an opacity vs. Ls is provided, TAU is the visible opacity at a pressure of PTOTAL. | ||
| − | |||
| − | |||
====Adjust for wavelength==== | ====Adjust for wavelength==== | ||
Revision as of 13:58, 30 January 2020
Contents |
Adequately Scale Dust Opacity
Definitions
PTOTAL:
Global annual mean surface pressure at 0 elev., Pascal[=.01mb];
If KPREF=2, global average of atmosphere plus cap system.
PTOTAL depends on the scale height you consider.
PTOTAL = 640Pa, 658Pa, 672Pa, 683Pa, 692Pa, 700Pa for scale heights H=7-8-9-10-11-12 km respectively. In reality, H oscillates over the course of a year.
KPREF:
Mean global pressure control.
0 = constant
1 = follows Viking Lander curve
2 = reduced by global frost, but then N4 must be >8, and latitudes must be monotonic increasing and must include both polar regions (no warning for your failure).
TAUD:
Opacity due to dust over solar wavelengths (weighted by solar spectral flux) for a column with pressure of PTOTAL at zero elevation.
It is used in code:  tlats8.f line 193, then 213. It can be over-ridden by using a climate file, in which case solar tau  at PTOTAL is IR_opacity  (from the file) / TAURAT
Simplest Case: Dust opacity Already Scaled to 0 Elevation
- If your dust opacity TAU is given for a pressure = PTOTAL (usually the case for TES/THEMIS), you do not have to scale for a different pressure.
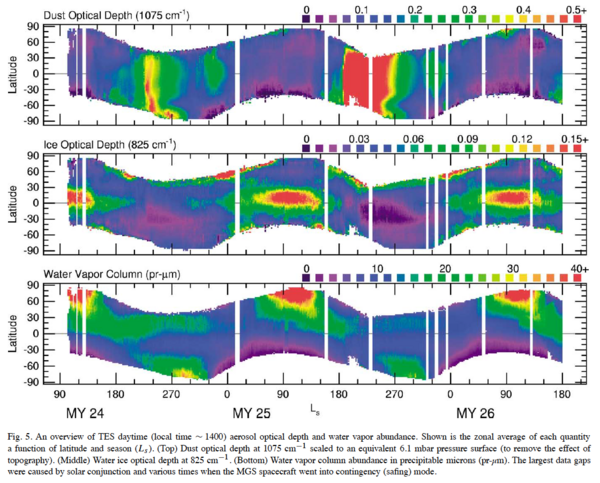
For example, in Smith 2003, Figure 5:
Caption:Fig. 5. An overview of TES daytime (local time ∼ 1400) aerosol optical depth and water vapor abundance.
Shown is the zonal average of each quantity a function of latitude and  season (Ls ).
(Top) Dust optical depth at 1075 cm-1 scaled to an equivalent 6.1 mbar pressure surface (to remove the effect of topography).
(Middle) Water ice optical depth at  825 cm-1.
(Bottom) Water vapor column abundance in precipitable microns (pr-μm).
The largest data gaps were caused by solar conjunction and various times when the MGS  spacecraft went into contingency (safing) mode.
In other words, if you are using a dust opacity scaled to a specific pressure = PTOTAL, no topographic correction is needed.
Lander or Rovers: Elevation-Specific Opacity
- If your dust opacity value is NOT given for a pressure of PTOTAL (usually the case for rovers and landers), you have two options:
- A: Keep the local elevation, but force a local pressure PTOTAL @ a specific Ls based on a climatological database, in order to use the local opacity.
- 1: Keep the local Elevation (determined by the local Latitude and Longitude)
- 2: Force PTOTAL to meet a desired value. For example, at Lat=4.5, Lon=135.6, Ls=300 (InSight after landing, we want the local pressure = 750 Pa. (http://www-mars.lmd.jussieu.fr/mcd_python/).
- This condition is met by forcing PTOTAL = 700.
Example:
Lat = 4.5
Lon = 135.6
PTOTAL = 700.
test = krc(lat=Lat,lon=Lon,PTOTAL=PTOTAL,ls=300.).anc.ref_pressure
Verify that @ Ls=300 => P=750. Pa
plot(test.anc.ref_pressure,"KRC",xaxis=test.ls)
Then use the visible dust opacity directly (or perform correction as indicated in the Table below).
- B: Scale the pressure and opacity to match predicted 0 elevation values (no climatology needed).
- 1: You must first scale it to PTOTAL: Calculate the local pressure P(z):
P0 is the reference pressure, also called PZREF. In theory, this is not PTOTAL, because the reference pressure too oscillates with Ls.
z is the elevation where the opacity measurement is made (VL1=-3.63,VL2=-4.50km, MPF=-3.68km,Spirit=-1.94km,Opportunity=-1.39km,MSL=-4.5km,InSight=-2.7km).
Z0 is the reference elevation for PTOTAL, so typically 0km.
H is the scale height in km.
- 2: Adjust the local dust opacity: The Opacity TAU at PTOTAL can then be derived using the following relation (M. Smith):
Note that if an opacity vs. Ls is provided, TAU is the visible opacity at a pressure of PTOTAL.
Adjust for wavelength
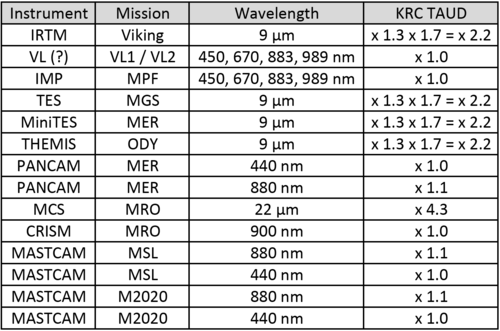
Dust opacities are given at different wavelengths in the literature. KRC works with opacity values at solar wavelengths. Use the table below to convert published opacity values to the best estimate for the visible wavelength opacity
Smith, M. D. (2004), Interannual variability in TES atmospheric observations of Mars during 1999-2003, Icarus, 167, 148-165.


